Corrosion is a degradation process by which materials react with their environment. Corrosion causes the formation of oxide scale which can reduce the mechanical, thermal, or electrical properties of materials, especially metallic materials. Ebatco’s NAT Lab can analyze the surface and cross section of oxides formed on samples along with determining their microstructure. We can identify the function and distribution of alloying elements within materials and determine the effectiveness of protective coatings. Our expertise enables us to measure coating properties such as thickness, wear resistance, hardness, etc. and analyze the interactions that occur at coating and substrate interfaces.

Typical Experimental Results

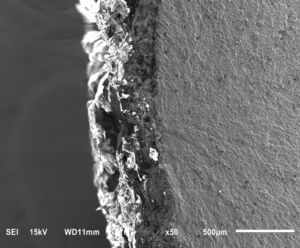
SEM image of a failed Ti-6Al-4V rod possessing a Titanium-Vanadium coating.

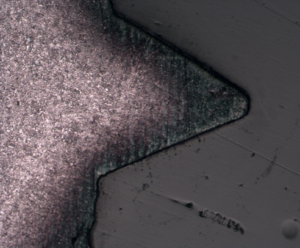
Optical microscopy image of a case hardened metal fastener.

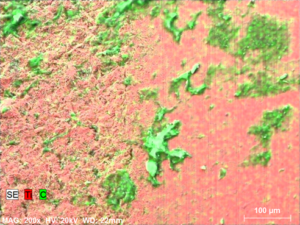
SEM/EDS image of a corroded Ti-6Al-4V dental implant’s surface.

Applications

Alloys Chemical Etching Case Hardening Carburization Corrosion Analysis
Cross-Section Analysis Crystal Structures Element Identification Failure Analysis Foreign Material Identification
Forensic Analysis Fractography Fracture Study Grains Grain Boundaries
Grain Growth Grain Orientation Grain Size Grain Structure IC Failure Analysis
Materials Metals Metallography Metallurgy Microscopy
Microstructure Phase Diagram Penetration Depth Spectroscopy Steels

For more information please read our application notes:

Compression Fracture of a Pellet Press ShaftPDF

Identify Unknown Materials and Coating by Energy Dispersive Spectrum

Tensile Fracture Failure Mechanisms of 316L Stainless Steel

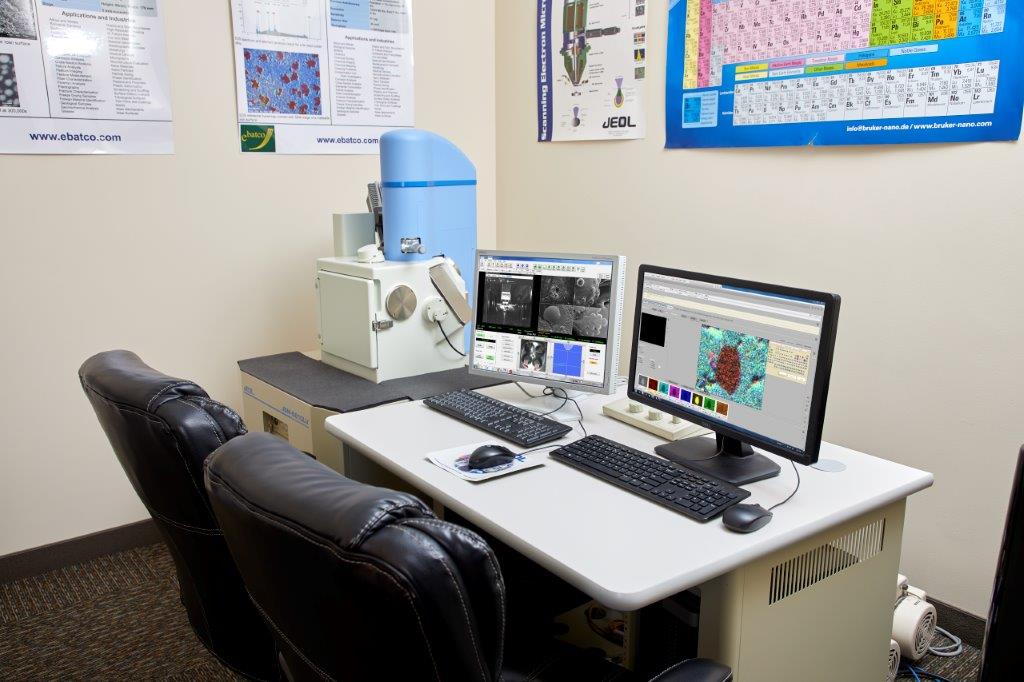
Instruments: JEOL 6610 LV Scanning Electron Microscope

Key Specifications

Filament W hairpin filament
Resolution High Vacuum: 3nm (30kV),
8nm (3kV), 15nm (1kV)
Low Vacuum: 4 nm (30kV)
Accelerating Voltage 300 V to 30 kV
Magnification 5x to 300,000x
LV Detector Multi-segment BSED
LV Pressure 10 to 270 Pa
Sample Sizes Height: 80mm; Width: 178 mm
Stage Eucentric 5 axis motor control, asynchronous movement, x-y: 125mm-110mm, z: 5mm-8mm, tilt:-10 to 90 degrees, rotation: 360 degrees
Resolution 5120 x 3840 pixels
Condenser Lens Zoom condenser lens
Objective Lens Conical objective lens
Compression Fracture of a Pellet Press Shaft

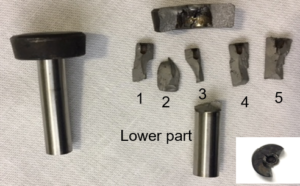
When parts break unexpectedly, determining the root cause is an important step in avoiding future problems. SEM fractography and composition mapping are excellent ways to determine the reasons behind part failures.  In this study, a shaft from a pellet press was examined after breaing during routine use.  Figure 1 shows the broken shaft compared to an intact shaft. The shaft broke into seven fragments and there was a small black hole at the top center of the shaft. The head of the shaft had a small protrusion which fit into the hole. The shaft was likely connected to the head by a welding or brazing process.

Figure 1. Intact (left) and fractured (right) pellet press shafts.

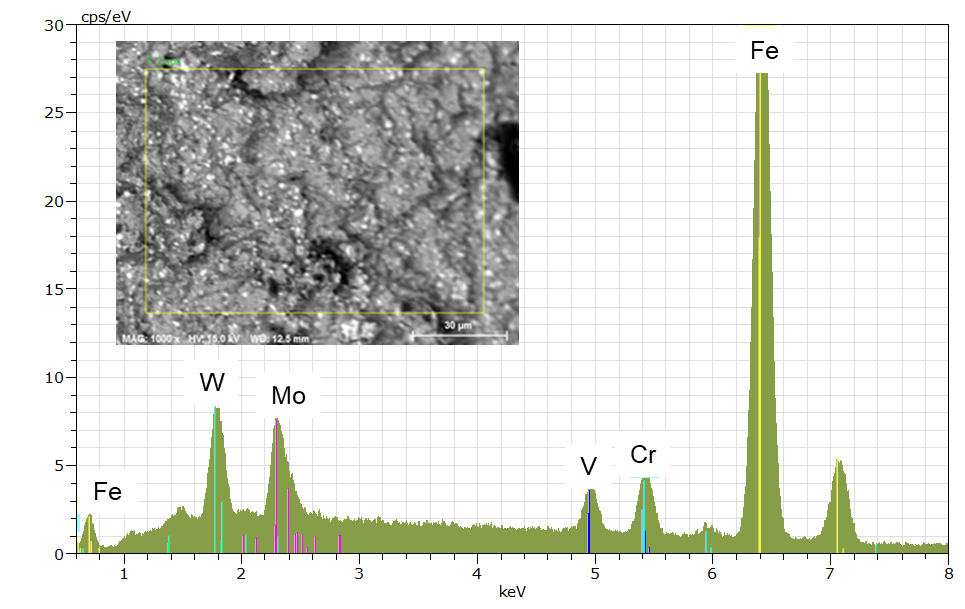
The composition of the shaft was analyzed by X-ray energy dispersive spectroscopy (EDS), the results of which are shown in Figure 2. The EDS spectrum indicates that the shaft was primarily composed of Fe, Cr, W, Mo and V, which are the most common elements used to create tool steels. The bright particles in the SEM image are W, Mo and V carbide particles added to limit the growth of cracks in the alloy and increase the mechanical strength of the material.

Figure 2. EDS spectrum of the fracture surface of the shaft. Inset: SEM image of the corresponding area.

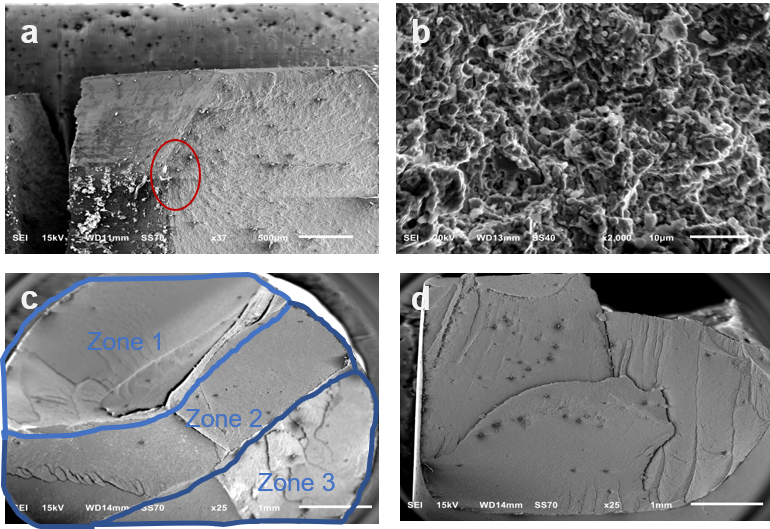
The microstructure of the compression fracture surface was investigated further using SEM (Figure 3). Figure 3a is the SEM image of fragment 5 from Figure 1. In fragment 5, chevron marks, or small lines which converge at the crack origination site. Chevron marks were not only observed in fragment 5, but also in fragments 1, 3, and 4. By tracing the chevron marks back, the fracture on fragment 5 originated from the bottom of the hole (red circle, Figure 3a). This location corresponds to the joint area between the shaft and the head, which is an area of high stress concentration. For this shaft fragment, several cracks initiated at the joint area, and the top part of the shaft broke into five pieces. After the crack initiated, the crack propagated downward at approximately 45º, which is the direction of highest shear stress. This also explains why fragment 2 had two slopes at about 45º angles (not shown).

A typical microstructure of the fracture surface at 2000X magnification is shown in Figure 3b.  Pieces 1 through 5 and the lower shaft had similar uneven and dimpled fracture surfaces, characteristic of ductile fracture. Some carbide particles were also found at the base of these dimples. The top view of the lower shafts’ fracture surface is shown in Figure 3c. Three unique areas were identified and labeled as zones 1, 2, and 3. Zone 1’s fracture surface has a cliff shape (Figure 3d). As shown in Figures 3c and 3d, cleavage lines formed on the fracture surface, demonstrating the growth direction of the cracks. Reassembling the fragments, fragment 2 fitted into zone 1, fragments 1 and 3 fitted into zone 2, and fragments 4 and 5 fitted into zone 3. The slopes on the fragments demonstrated that the cracks grew due to shear stress.

Figure 3. Fracture surface microstructures. a) SEM image of fragment 5, b) Typical microstructure of the fracture surface at 2000x, c) Top view of the fracture surface on the lower shaft, d) Zone 1 fracture surface.

Based on morphological analysis, the fracture was identified as a ductile compression fracture. The cracks initiated at the joint area between the shaft and the head, and grew along the highest shear stress direction. The size and distribution of the carbide particles were homogenous. No large carbide segregation was observed at the critical areas. The failure of the shaft was due to an overload of compressive force.

ASTM Number Title Website Link
A262 – 15 Standard Practices for Detecting Susceptibility to Intergranular Attack in Austenitic Stainless Steels Link
A763 – 93(2009) Standard Practices for Detecting Susceptibility to Intergranular Attack in Ferritic Stainless Steels Link
A802 – 95(2015) Standard Practice for Steel Castings, Surface Acceptance Standards, Visual Examination Link
B487 – 85(2013) Standard Test Method for Measurement of Metal and Oxide Coating Thickness by Microscopical Examination of Cross Section Link
B578 – 87(2015) Standard Test Method for Microhardness of Electroplated Coatings Link
B748 – 90(2016) Standard Test Method for Measurement of Thickness of Metallic Coatings by Measurement of Cross Section with a Scanning Electron Microscope Link
E1077 – 01(2005) Standard Test Methods for Estimating the Depth of Decarburization of Steel Specimens Link
E1508 – 98(2008) Standard Guide for Quantitative Analysis by Energy-Dispersive Spectroscopy Link
E3 – 01(2007)e1 Standard Guide for Preparation of Metallographic Specimens Link
E340 – 00(2006) Standard Test Method for Macroetching Metals and Alloys Link
E381 – 01(2012) Standard Method of Macroetch Testing Steel Bars, Billets, Blooms, and Forgings Link
E384 – 09 Standard Test Method for Microindentation Hardness of Materials Link
E384 – 10e2 Standard Test Method for Knoop and Vickers Hardness of Materials Link
E407 – 07(2015)e1 Standard Practice for Microetching Metals and Alloys Link
E7 – 03(2009) Standard Terminology Relating to Metallography Link
F2328 – 17 Standard Test Method for Determining Decarburization and Carburization in Hardened and Tempered Threaded Steel Bolts, Screws, Studs, and Nuts Link

ISO

Title Link

9220:1988

Metallic coatings — Measurement of coating thickness — Scanning electron microscope method

Link

5949:1983

Tool steels and bearing steels — Micrographic method for assessing the distribution of carbides using reference photomicrographs

Link

4499-4:2016

Hardmetals — Metallographic determination of microstructure — Part 4: Characterisation of porosity, carbon defects and eta-phase content

Link

4499-1:2008

Hardmetals — Metallographic determination of microstructure — Part 1: Photomicrographs and description

Link

3887:2017

Steels — Determination of the depth of decarburization

Link

26146:2012

Corrosion of metals and alloys — Method for metallographic examination of samples after exposure to high-temperature corrosive environments

Link

18203:2016

Steel — Determination of the thickness of surface-hardened layers

Link

11845:1995

Corrosion of metals and alloys — General principles for corrosion testing

Link

11463:1995

Corrosion of metals and alloys — Evaluation of pitting corrosion

Link

10271:2011 Dentistry — Corrosion test methods for metallic materials

Link